Based on MapGuide’s Open Source web-based platform, it publishes network data from not only SpatialBASE as well as other 3rd party GIS/non-GIS systems and rolls up data (both spatial and tabular) for presentation in a user-friendly manner. It is highly customizable and supports simple, but powerful reporting and export (Excel, HTML, XML) capabilities on a point-and-click basis. As a roll-up application it is designed to link GIS data from SpatialBASE (and other GIS sources) with data from OSS applications such as order management, trouble ticketing, and network monitoring. By tying in geographic links (such as address or facility identifiers), SpatialNAVIGATOR can display service orders, trouble tickets, and locations of faulty network devices. It can be used to quickly report on affected customers for a given outage or visually correlate outages to a specific event (such as broken pole).
SpatialNAVIGATOR - AVL
SpatialNAVIGATOR is CADTEL’s browser-based, GIS information portal.
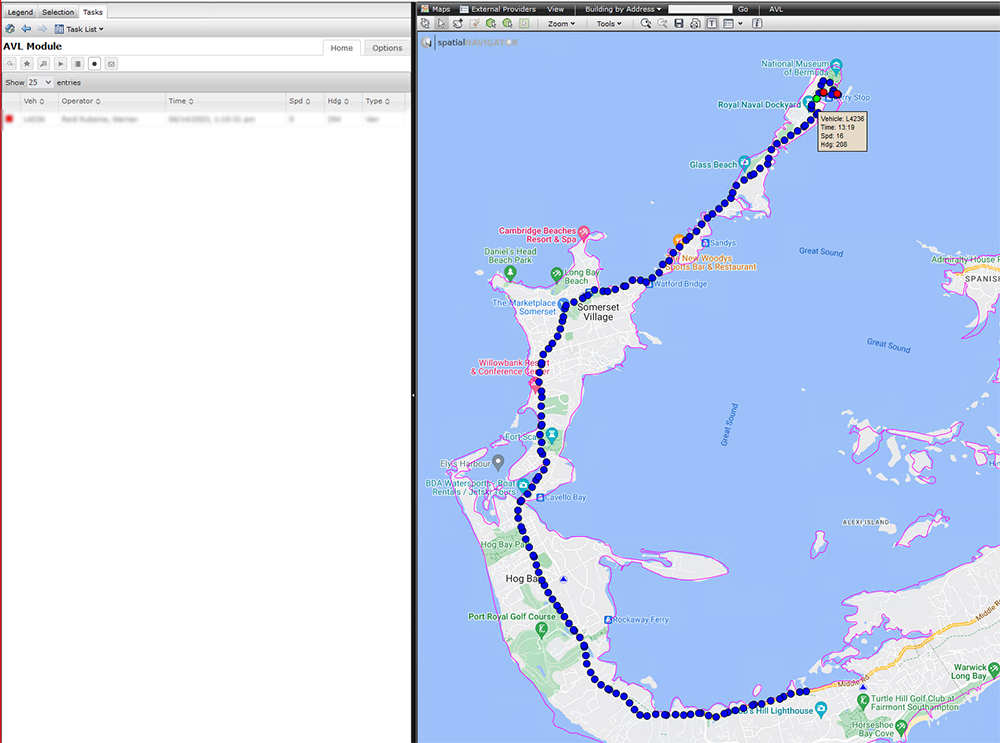
SpatialNAVIGATOR supports a variety of customized modules to enhance the use of the telecom data and not only. One of these modules is the Automatic Vehicle Locator (AVL) module. The AVL module is CADTEL’s telematics solution to enable consumption, visualization, and reporting on cars, trucks, equipment, and other assets GPS and on-board diagnostics (OBD) data. AVL is becoming an integral part of the management of fleets on the field.
Some of the capabilities included in CADTEL’s SpatialNAVIGATOR AVL module include:
- Support for tracking vehicles out on the field: Through direct communication with the tracking equipment on the vehicles (Assets)
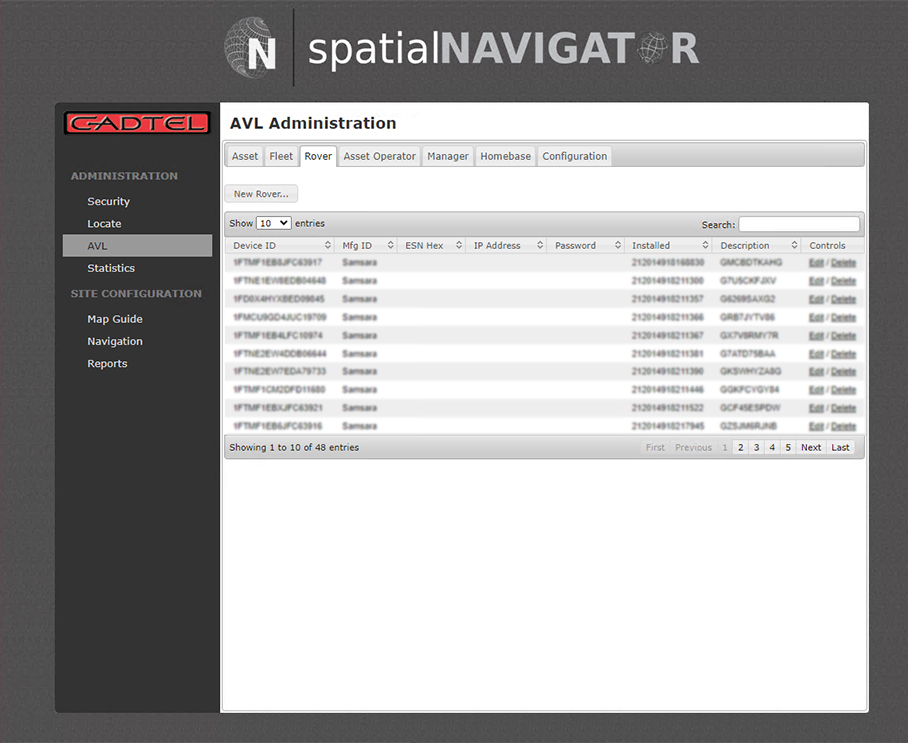
- Support for tracking vehicles out on the field: Through integration with other Vehicle Telematics vendors, such as Samsara
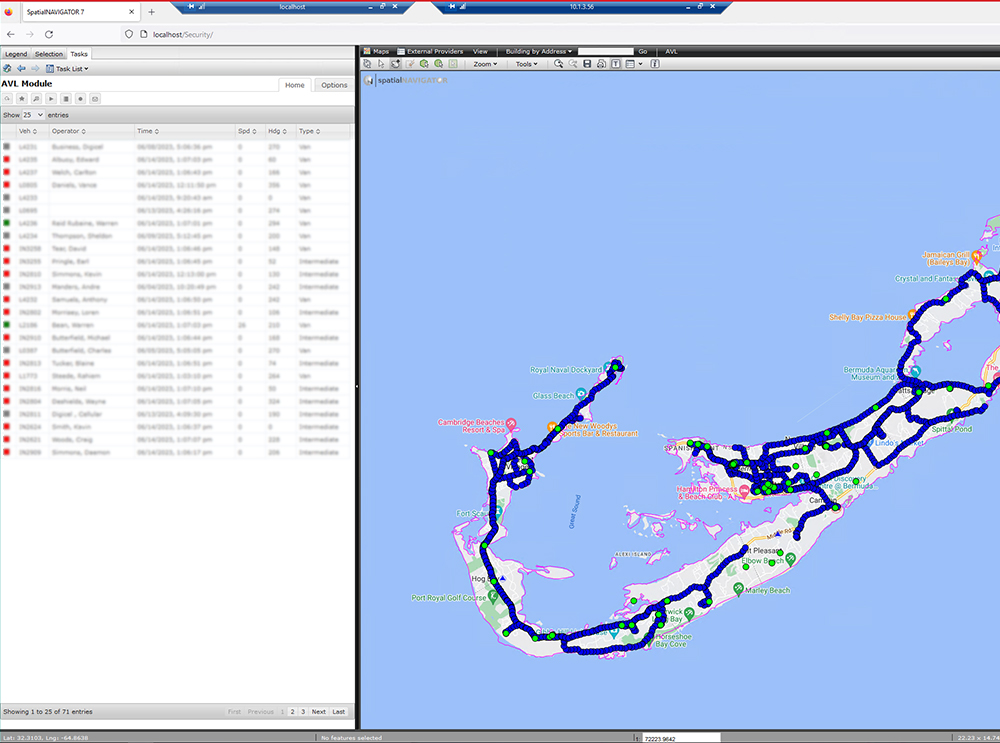
- Support for fleet grouping as well as individual assets to ease management of assets
- Organizational management of fleets to enable a variety of operational decisions for a Telcom company
- Realtime tracking and reporting of assets, with color coordinate indicators to quickly visualize the status of assets.
- In addition to realtime reports, the is support of historical views and reports – including information such as start/stop times, geographical information of stop locations, stop duration, speeds, headings, etc.
- Help managers monitor fleets by creating operational boundaries (homebases). This enables monitoring and reporting asset movements outside the homebase boundaries during the day as well as overnight parking.


